|
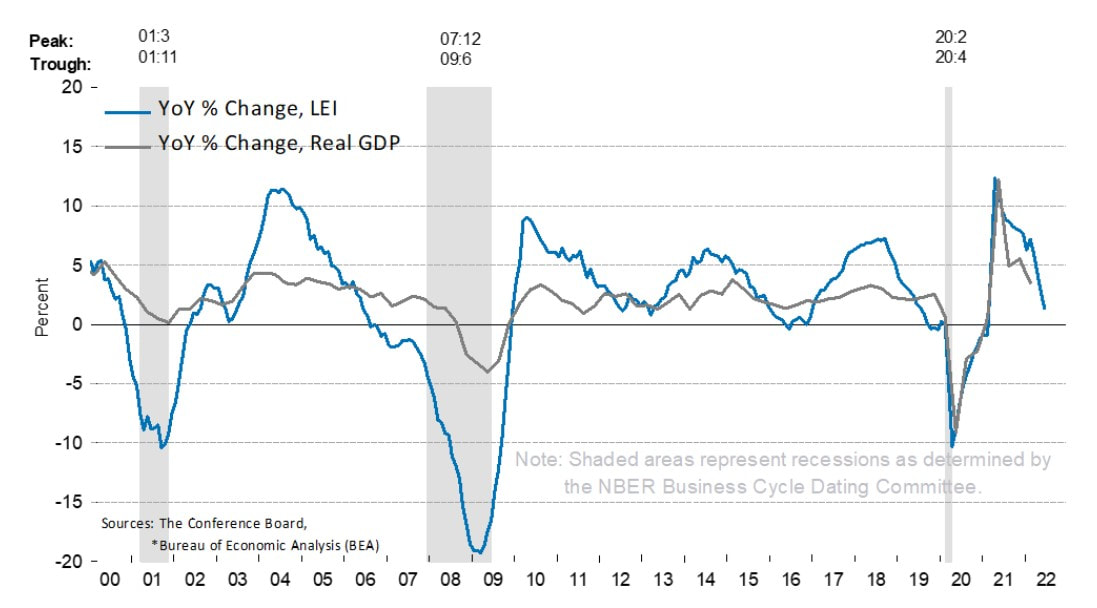
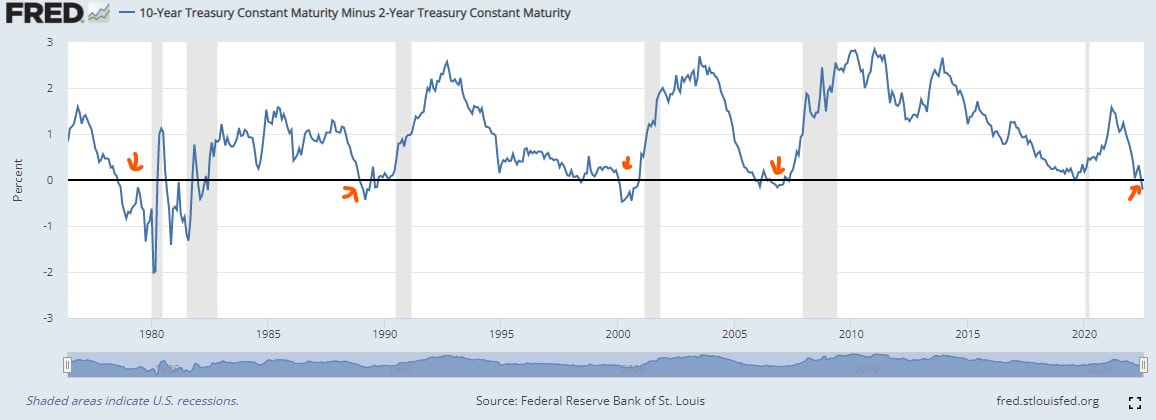
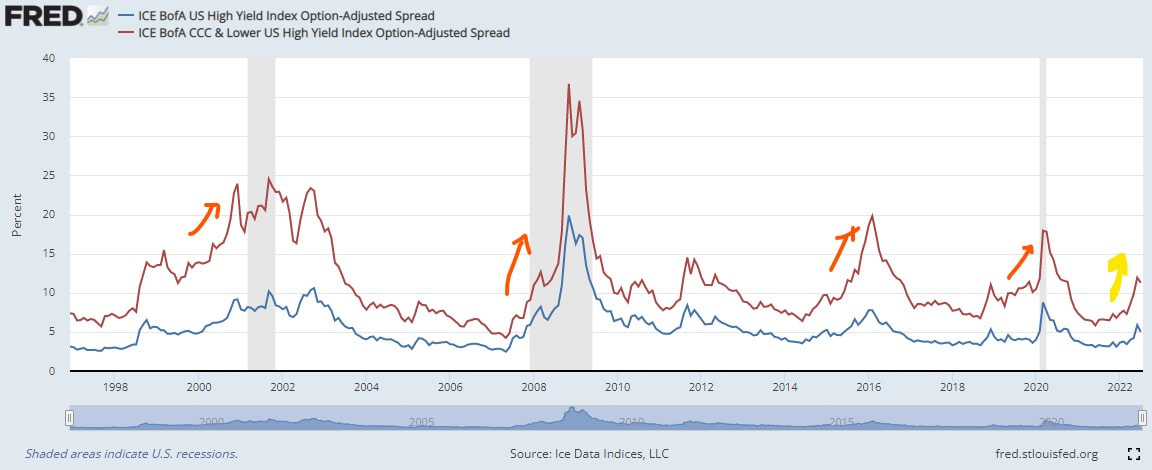
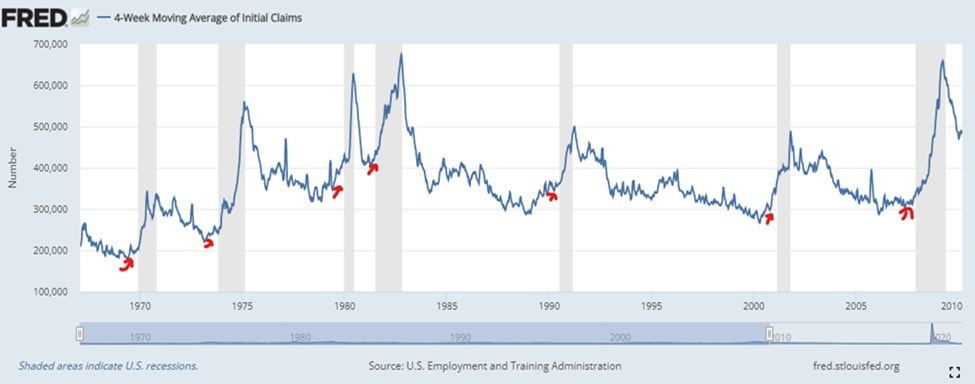
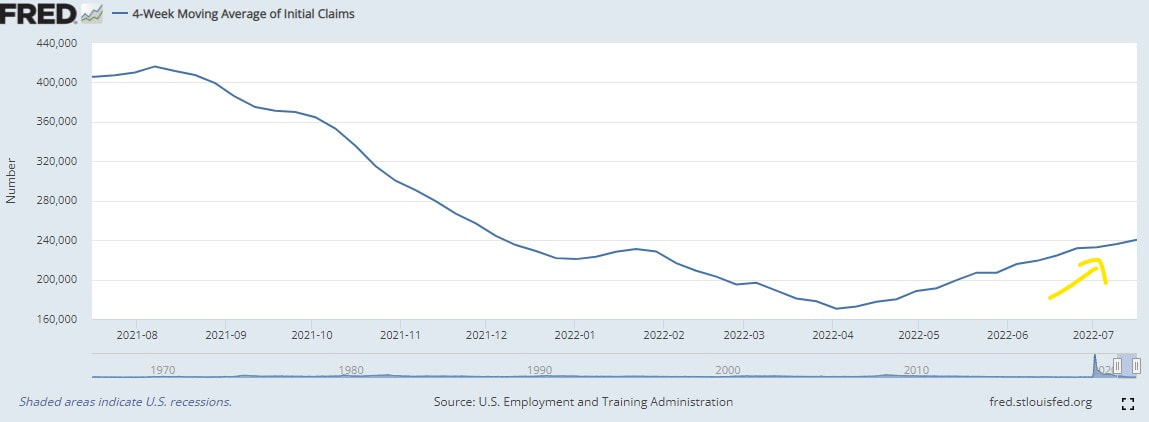
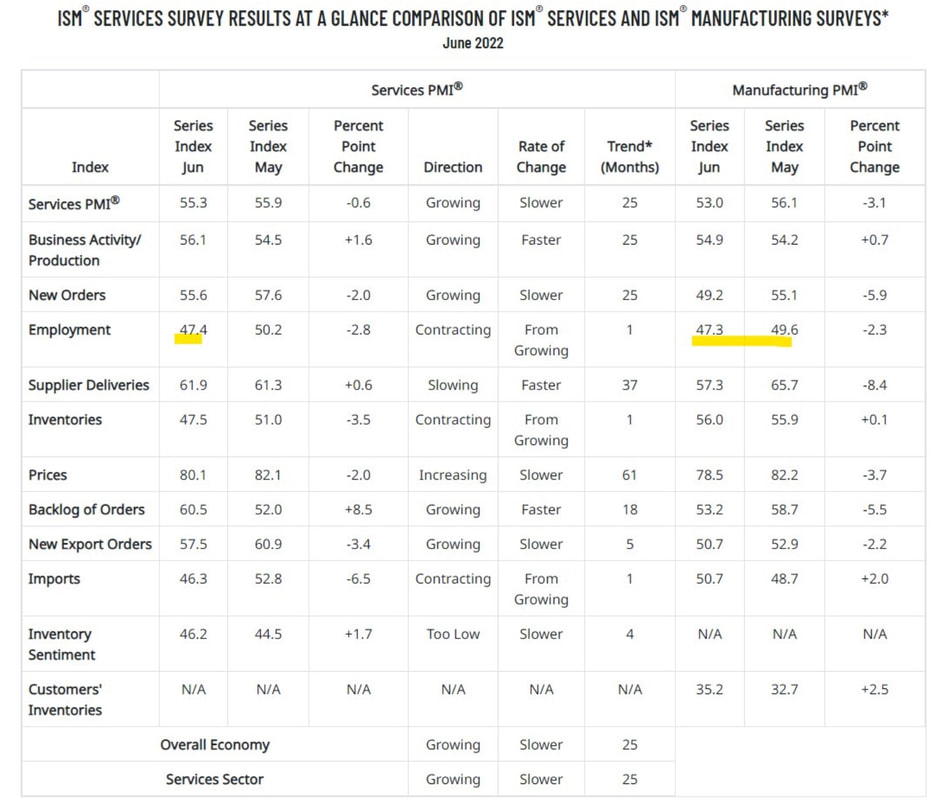
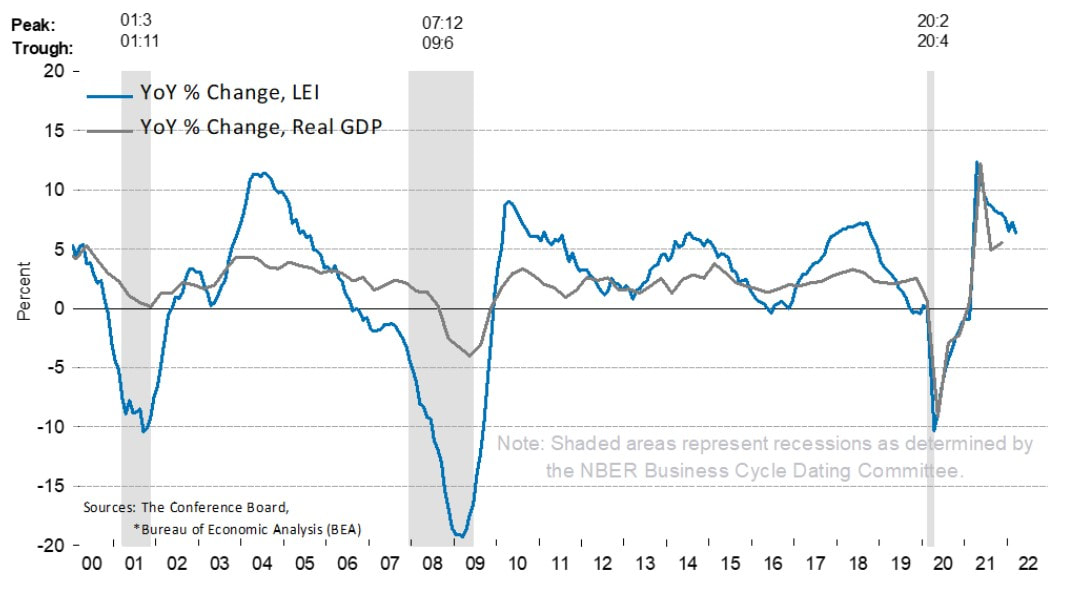
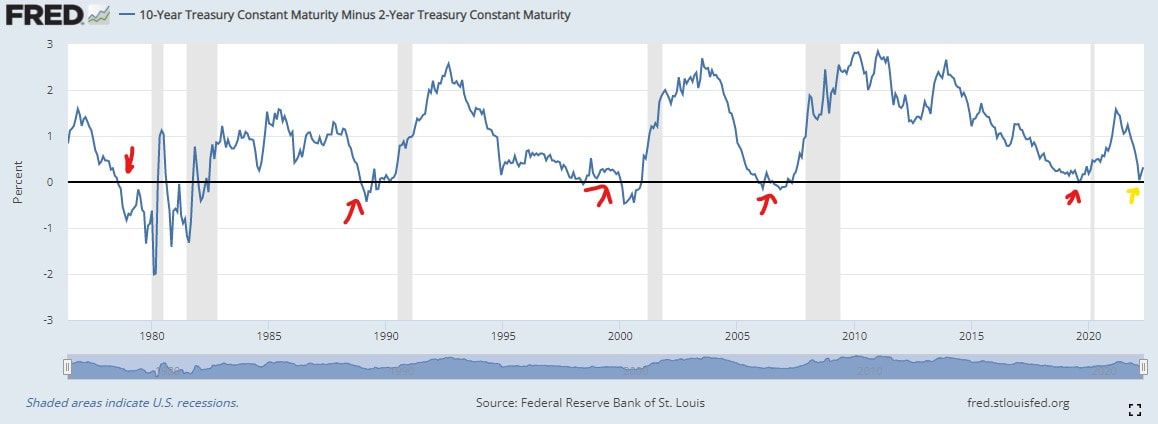
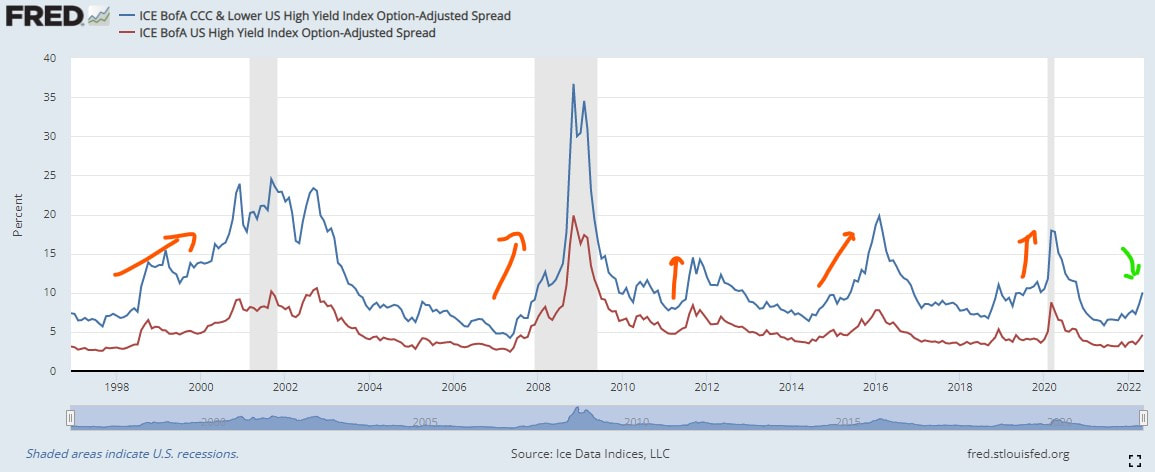
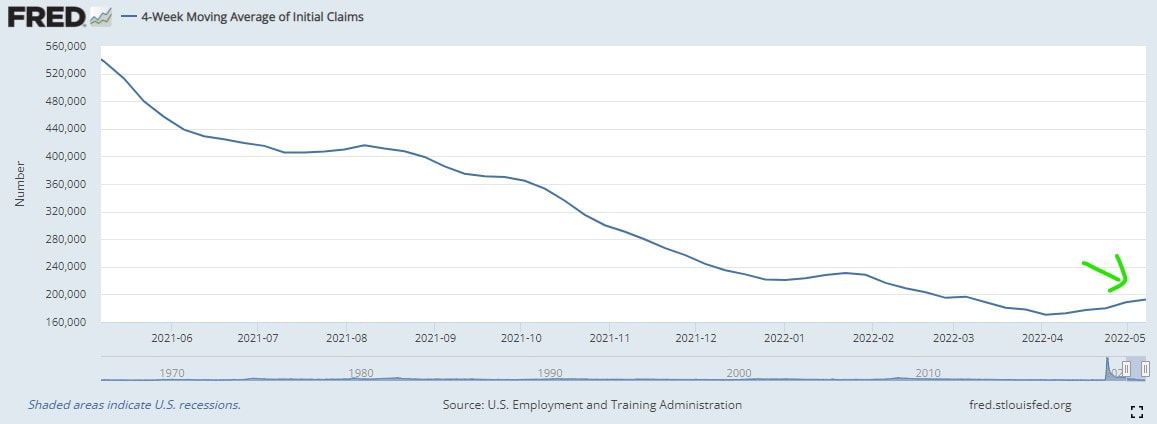
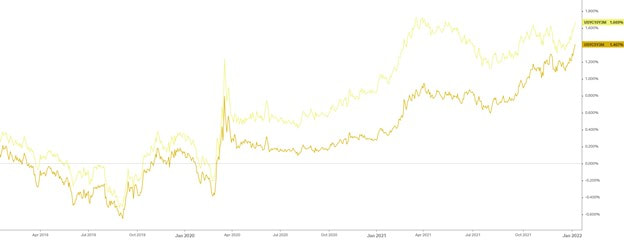
For context, here is the original Recession Framework essay LINK . Here is my recession framework that has proven the test of time. It has identified every recession Post World War II. There are four key criteria. Think of this as a dashboard with green, yellow, or red lights. If the dashboard is mostly green - sprinkled with a few yellows - we are safe. As the count of yellow and red lights rises, so does the risk of a recession. Similarly - reds turning to yellows is a sign of optimism -that the worst may be behind us. Remember, this is a dimmer, not an on/off switch. 1) Is the Leading Economic Indicator (LEI) gauge falling sharply and close to Zero? YES The LEI is a comprehensive forward looking metric that accounts for manufacturing new orders, building permits, change in hours worked, credit issuance, interest rates, stocks prices etc. As you can see above, when the LEI falls sharply and turns negative, a recession follows. Today, the LEI is falling sharply again, and close to turning negative. Manufacturing new orders and hours worked[1] in the ISM surveys are already contracting. Today, this is a yellow, but turns to a red once it falls below zero. 2) Has the yield curve inverted? Yes When long term rates are below short-term rates, lending is unprofitable. So, banks stop lending. New businesses cannot get off the ground and existing businesses cannot expand. This slows new economic activity. The 10 year rate is now firmly below the 2 year rate for several weeks, or inverted, in investment terminology. This is flashing red. As you can see in the chart above, a recession follows within 6 – 12 months of yield curve inversion. 3) Are credit spreads widening significantly? Almost When junk bond yields move significantly compared to (safe) treasury yields, it is a major warning. Investors are selling risky investments and buying safe ones. They are demanding a significant premium to compensate for the rising risk. Indicated by the red arrows above, at least a deep market sell-off, if not a recession follows. Today, credit spreads are moving higher, warning of potential trouble ahead, but not at recession levels. Today, this is a yellow, but close to turning red. 4) Are unemployment claims rising sharply? Almost When a business lays off an employee, that layoff is reported to the government and is captured as an unemployment claim. To avoid false signals, we need claims to rise sharply. This triggers a warning sign for the labor market. 70% of U.S. GDP depends on consumer spending, and consumers don’t spend when they are fearful of layoffs. As the red arrows (long term chart above) indicate, recession follow sharp and sustained spikes in claims. Over the past four months, claims have risen more than 25% (see below). A further rise would make a recession official. The recession dashboard has 1 red and three yellow lights. The deterioration since March speaks for itself. The yellows and red indicate we are on the cusp of a recession. (1) Employment in the manufacturing survey has contracted for May and June and June only for services (number below 50 indicates contraction) --
This material does not constitute an offer or solicitation to purchase an interest in Latticework Partners, LP (the "Fund"). Such an offer will only be made by means of a confidential offering memorandum and only in those jurisdictions where permitted by law. An investment in the Fund is speculative and is subject to a risk of loss, including a risk of loss of principal. There is no secondary market for interests in the Fund and none is expected to develop. No assurance can be given that the Fund will achieve its objective or that an investor will receive a return of all or part of its investment. This material contains certain forward-looking statements and projections regarding the future performance and asset allocation of the Fund. These projections are included for illustrative purposes only, are inherently speculative as they relate to future events, and may not be realized as described. These forward-looking statements will not be updated in future.
1 Comment
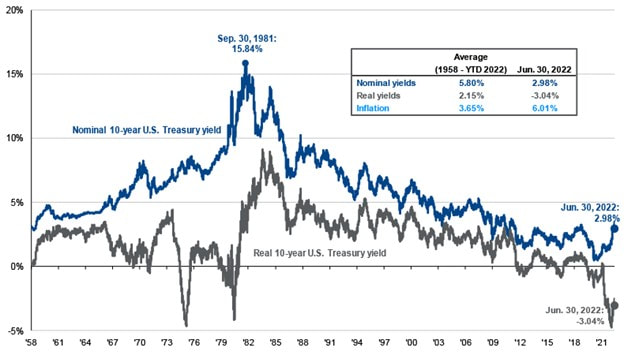
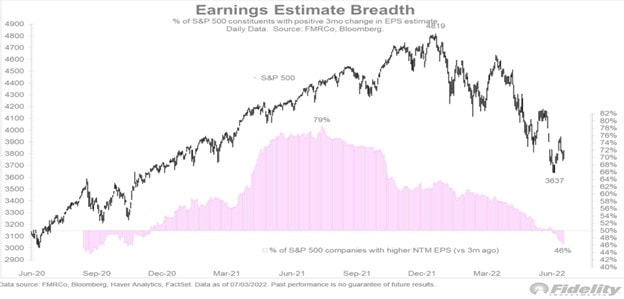
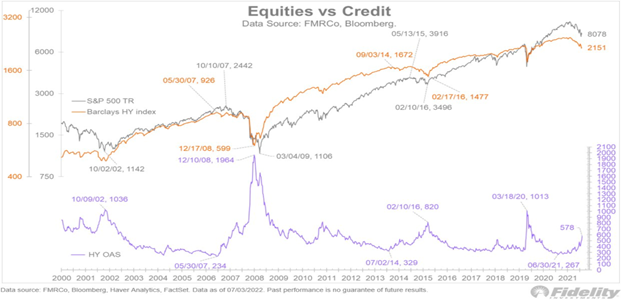
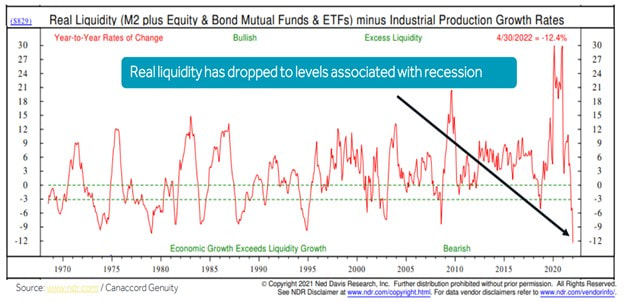
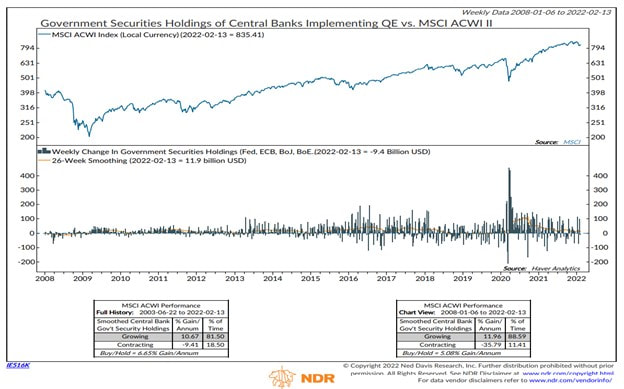
Markets are complicated. Simplify and keep it REAL. REAL is a practical risk-on/risk-off framework to monitor market conditions. REAL is an acronym to monitor changes in Rates, Earnings breadth, Availability of credit, and Liquidity waves. Consider this a dimmer, not an on-off switch. When every component is worsening, be fearful. When every component is improving, be greedy. Rates: A practical risk-free rate is the 10-year U.S. treasury. As the 10-year goes up, future cash flows are worth less and vice versa. In 2022, the 10-year has doubled, at the fastest pace in history. Higher rates make big-ticket purchases less affordable. Rapidly rising rates are bad for markets. Chart 1 - Nominal and Real U.S. 10 Year Treasury Yield Source - JP Morgan Asset Management Earnings Breadth: When earnings for a wide range and breadth of companies in disparate industries are rising, economic and market expansion has momentum. The market advance is durable. Today, the earnings expansion is transitioning to earnings contraction. The number of companies and industries where earnings are declining is rising. Earnings breadth is deteriorating, which is bad for markets. Chart 2 - S&P Earnings Breadth Source - Jurien Timmer, Fidelity Availability of Credit: Credit is the grease that keeps the economic wheel turning. As economic uncertainty rises, banks reduce the amount they lend and charge higher rates. Individuals and businesses with lower credit scores find it harder to get loans. Similarly, investors demand an above-average compensation to own risky investments. This is reflected in rising credit spreads (see the purple line on chart 3). The higher spread eventually cascades all the way to every corner of the market, regardless of the underlying quality, and compresses the valuation of all assets. When credit becomes scarce, the grease dries, the economic wheel stops turning, and markets fall. Chart 3 - S&P 500 and High Yield Credit Spreads Source: Jurien Timmer, Fidelity Liquidity waves: Liquidity moves markets. When the Fed provides liquidity via Quantitative Easing, investors rush in and take risk. Equity market goes up. When the Fed stops, the opposite happens. In 2022, liquidity has contracted at the fastest rate in history. Rapidly declining liquidity leads to declining markets. Chart 4 - Liquidity Source: Ned David Research/ Canaccord Genuity
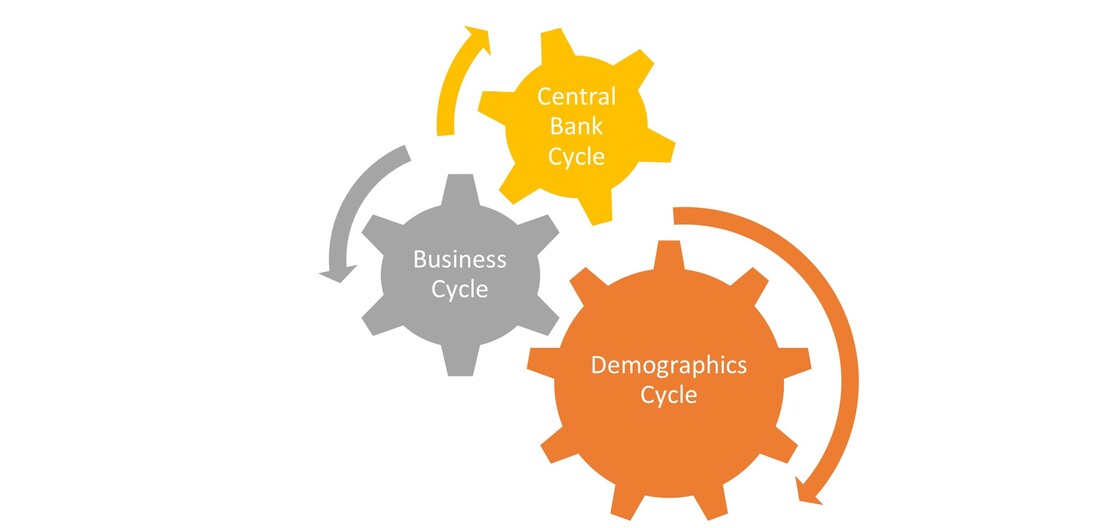
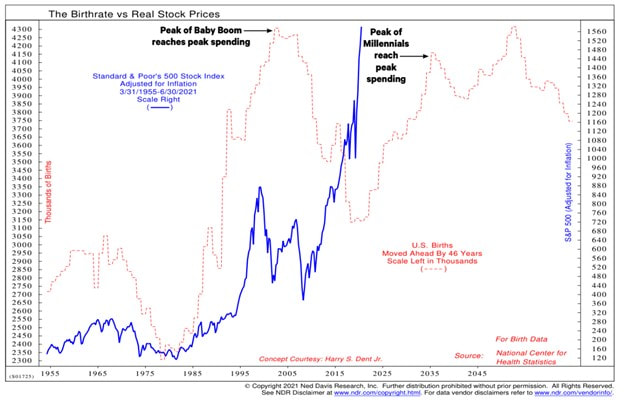
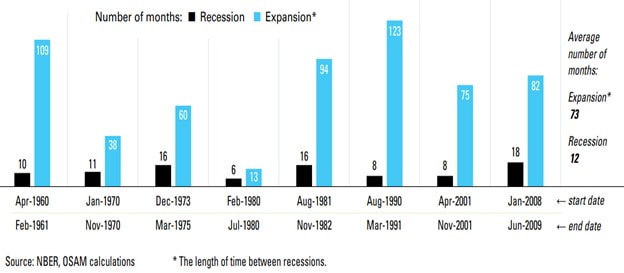
When I wrote ‘Draining the Punch Bowl’ (LINK) in January, it was in anticipation that multiple components of the REAL framework would deteriorate. They have. As a result, the S&P 500 declined by 20% in the first quarter of 2022. For markets to stop declining and stage a durable turnaround, Rates, Earnings breadth, Availability of credit, and Liquidity need to reverse. Don’t guess. Keep it REAL. “The market is a pendulum that forever swings between unsustainable optimism and unjustified pessimism.” – Benjamin Graham The Superinvestors of Graham and Doddsville [1] lived between two emotional stations. Peace and equanimity. Both are wonderful places for investors to reside. The rest of us mere mortals oscillate between fear, confidence, chaos, arrogance, panic, and euphoria. Why? The Superinvestors had a trusted framework to recognize value investments, which served as their North Star. This framework kept them grounded and impervious from Mr. Market’s emotional hijackings. Investors spent most of their time digging for the next great investment, rather than building a framework that does the work. Repeated success builds trust. Without such a framework, we give up when our investments go against us. Let me give you a personal example. My first day as a professional investor was June 1st, 2006. What followed was the global financial crisis. From 2007 to 09, the S&P fell by 58%. Early on, It was clear as daylight that U.S. consumer balance sheets were over-levered. They had very few options but to cut back on spending. However - as a rookie - the banking crisis was past my comprehension. The lack of understanding of market cycles, the barrage of bad news, and a long bear market made me deeply pessimistic. My wife jokes that I was busy opening multiple bank accounts to protect our savings when we barely had any to begin with. “What if our bank is the next Bear Stearns?” The undeniable truth of recessions - no matter how bad - is that they all end! I stayed in my deeply pessimistic state for much longer. It was a great lesson to never make that mistake again. I realized that great money management requires thinking in frameworks. I see many investors making similar mistakes today. Without a framework, long periods of volatility bring out the worst in us. Today, high-growth investors are looking to invest in Energy. U.S. investors are making macro assessments on Europe. Would it surprise you that investors have turned into arm-chair military strategists? Investors who pick businesses are predicting the Fed’s next move (LINK) or when the U.S. economy will enter a recession. None of this is in any way surprising. The market has only one job – and that job is to fool the majority. Here is my recession framework that has proven the test of time. It has identified every recession post World War II. There are four key criteria. Think of this as a dashboard with green, yellow, or red lights. If the dashboard is mostly green - sprinkled with a few yellows - we are safe. As the count of yellow and red lights rises, so does the risk of a recession. Similarly - reds turning to yellows is a sign of optimism -that the worst may be behind us. 1) Is the Leading Economic Indicator (LEI) gauge falling sharply and close to Zero? NO The LEI is a comprehensive forward-looking metric that accounts for manufacturing new orders, building permits, changes in hours worked, credit issuance, interest rates, stocks prices, etc. As you can see above, when the LEI falls sharply and turns negative, a recession follows. For the LEI to turn negative, multiple end markets are either in a sustained slowdown or in outright decline. Today, the situation is different. The LEI reflects a strong, but slowing economy. 2) Has the yield curve inverted? NO When long-term rates are below short-term rates, lending is unprofitable. So, banks stop lending. New businesses cannot get off the ground and existing businesses cannot expand. This slows new economic activity. Today, the 10 year vs. 2 year curve is close to zero but hasn’t crossed below. Our yield curve indicator is flashing yellow light. We need to be watchful. As you can see in the chart above, a recession follows within 6 – 12 months of yield curve inversion. 3) Are credit spreads widening significantly? NO When junk bond yields move significantly compared to (safe) treasury yields, it is a major warning. Investors are selling risky investments and buying safe ones. They are demanding a significant premium to compensate for the rising risk. Indicated by the red arrows above, at least a deep market sell-off, if not a recession follows. Today, credit spreads although rising, are still at benign levels. 4) Are unemployment claims rising sharply? No When a business lays off an employee, that layoff is reported to the government and is captured as an unemployment claim. To avoid false signals, we need claims to rise sharply. This triggers a warning sign for the labor market. 70% of U.S. GDP depends on consumer spending, and consumers don’t spend when they are fearful of layoffs. As the red arrows indicate, recession follows sharp and sustained spikes in claims. Today, we are seeing quite the opposite. The jobs market is strong and unemployment claims are near lows (see below). This dashboard has 3 greens and one yellow light. While the probability of a recession is clearly higher today vs. six months ago, our dashboard indicates that a recession in 2022 is still unlikely. Thinking in frameworks keeps us objective. Most importantly, it keeps our emotions in check so we don’t oscillate between fear, confidence, chaos, arrogance, panic, and euphoria. It has helped me immensely. While it won’t miraculously transform us into the Superinvestors of Graham and Doddsville, the road to Peace and Equanimity starts by thinking in frameworks. [1] The Superinvestors of Graham and Doddsville (LINK) -- This material does not constitute an offer or solicitation to purchase an interest in Latticework Partners, LP (the "Fund"). Such an offer will only be made by means of a confidential offering memorandum and only in those jurisdictions where permitted by law. An investment in the Fund is speculative and is subject to a risk of loss, including a risk of loss of principal. There is no secondary market for interests in the Fund and none is expected to develop. No assurance can be given that the Fund will achieve its objective or that an investor will receive a return of all or part of its investment. This material contains certain forward-looking statements and projections regarding the future performance and asset allocation of the Fund. These projections are included for illustrative purposes only, are inherently speculative as they relate to future events, and may not be realized as described. These forward-looking statements will not be updated in future. 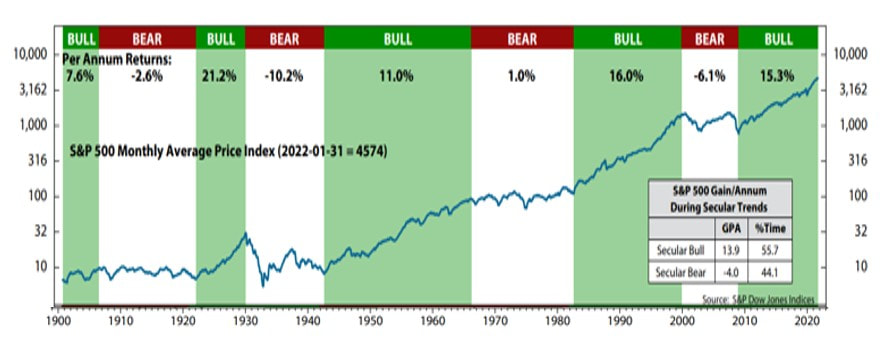 Source – Ned Davis Research When asked for a market forecast, J.P.Morgan replied – “it will fluctuate, young man, it will fluctuate.” Now, Mr. Morgan must have been a pessimist because the S&P 500 has surpassed even the most optimistic forecasts by averaging a 6% annual return over the past century. Before you get excited and jump aboard this cruise ship, pack some Dramamine. This is a rocky ride. There have been periods of intense euphoria, gut-wrenching anguish, with periods of utter boredom in between. Quite analogous to the past 5 years, the 1920s, the 1960s, and the 1990s were bull markets fueled by innovation. The S&P rose 213% between January 1995 – January 2000, a 26% annual return. Post-Y2K, markets hit rough seas. From the peak of March 2000 to the trough in March 2009, the S&P lost 56% or 8% annually. A ship lost at sea. The 1970s were dominated by inflation, commodity shortages, and volatility, but a decade where markets were flat as a Royal Caribbean pancake. This begs the question, what are the fundamental reasons for markets to behave in such a manic-depressive way? What Drives Market Fundamentals? Like any economy, the markets also go thru cycles. These cycles are a byproduct of three larger cycles: 1) Demographics, 2) Business and 3) Central Banks. When these three are in unison, markets advance like speed boats. The fantastic returns from 2020-21 are a perfect illustration. So is the period from the late ’90s. However, when they work as a tandem in reverse, they produce the lost decade of 2000-09. Let’s dive into the specifics of each cycle and how it works. Let's Talk Demographics. Source – Ned Davis Research Our economy grows when we collectively spend more. However, only structural factors can drive aggregate spending over a long period. A demographically driven growth spurt is one of those structural reasons. Simply, when a couple gets married and is close to having a baby, they buy a house. They buy a larger car. The household spends more. Down the road, they have another baby. They buy an SUV or a minivan and move to the suburbs! They are motivated to earn more because they spend more. When a large population cohort enters this life stage – think Baby Boomers in the late 70s and early 80s – it unleashes earning potential for businesses and opportunities for entrepreneurs. A rising tide lifts all boats. Demographic forces are measured in decades and provide structural tailwinds for markets over a long duration. Look at the chart above to understand the power of demographic inflections. The opposite creates a strong undertow that produces immense drag. The lost decade wasn’t an anomaly. Today, we are in the early innings of another structural acceleration. Millions of Millennials are entering a household formation phase, leading to another demographic inflection. What took place in the early ’80s is repeating again, today! What is a business cycle? Source - OSAM A business cycle is simply a boom-bust cycle measured over several years. An event creates a disruption for business. To conserve cash flows, businesses reduce investments, inventories, and lay off employees. Consumers react and reduce their own spending. This virtuous cycle turns into a recession. Over time, as the impact wanes and spending troughs, consumers stop being scared and cautious. We start to spend again. Businesses gain the confidence that the economy has cyclically turned for the better, hire employees, and invest in plants and inventories. This leads to more hiring, more investments, and more consumer spending. The anguish from the ‘event’ fades into distant memory. Animal spirits return … just in time for another ‘event’ to sap our collective enthusiasm. We rinse and repeat. Business cycles, or boom-bust cycles, occur even in the context of a larger demographic cycle. Central Bank cycle Source – Ned Davis Research
The last, and arguably the most dramatic, is the Central Bank Cycle. Whether right or wrong, our Central bank, a.k.a The Fed has a two-pronged mandate; 1) maximize employment and 2) avoid extended bouts of high inflation. The Fed swoops in during a bust to protect the economy and jobs by reducing interest rates and by supplying excess money. In theory, this makes sense. This alternative money acts countercyclically when consumers and businesses are retrenching. This is how we get over the ‘event’. When the business cycle gains momentum again, the Fed removes its monetary help, hoping the businesses can be self-sustaining. However, if inflation rises too quickly, the Fed steps in. They tap the economic brakes. Reduced demand and business activity help to cool inflation. Although, the Fed’s track record is poor. Business cycles don’t generally end. The Fed ‘kills’ them by going too far. Look at the illustration above to see how markets follow Fed movements. A Powerful Combo To add context around these three cycles, think of ‘Covid’ as the event. Covid was the catalyst for ending the previous business cycle. Central banks around the world started a new cycle by pumping massive amounts of money. Covid accelerated a ‘Millennial demographic cycle’. Young city dwellers moved to the suburbs in droves in search of extra living space. Babies and minivans come next! A new business cycle was born. Businesses flipped from layoffs to hiring. Most of the jobs lost were recovered. This cycle is also atypical. What takes several years was accomplished in several months. The S&P rose 115% from March 2020 to December 2021. Now inflation is very high. The Fed support is at its apex. The business cycle could also be at its apex. Well, guess what, we have another ‘event’. Could the collateral damage from a war trigger another bust? Only time will tell. History doesn’t repeat itself; humans do – A Wise Man While the ‘event’ is always different, and extenuating circumstances vary, the chronology of boom-bust cycles is always the same. A wise man once said, “history doesn’t repeat itself, humans do.” Consumers and businesses act predictably to every boom and bust. However, the bust period is shorter and shallower if it happens in the context of a longer and more powerful demographic cycle. Let’s go back to J.P.Morgan’s answer, “it will fluctuate, young man, it will fluctuate.” Markets do fluctuate short term. A hundred years of history also suggests that markets cruise long term. However, most investors miss out because they get greedy at peaks and fearful at troughs. At Latticework, we map the inner workings of cycles and the businesses they impact. We use this compass to deconstruct why markets do what they do and navigate the fluctuations. We can help, especially when the seas are rough. Reach out to us. Late last year, there were multiple data points screaming that inflation was rising at an alarming rate, labor markets were very strong, and interest rates were in record negative territory. Therefore, the Fed was extremely behind in normalizing policy. One need not be a ‘Macro investor’ to come to this simple conclusion. The payoff to protect portfolios was asymmetric and in favor of one who has the courage to go against this trend. When I wrote this note (LINK) most of the replies that I received were that inflation was ‘transitory’. After two consecutive prints of CPI > 7%, that narrative has flipped on its head. 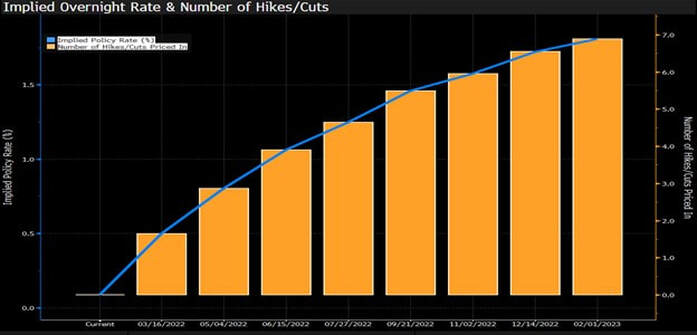 Source - Bloomberg However, over the past month, most investors and economists are now racing to beat each other in predicting record rate hikes. As of today February 17th, markets are expecting a half percentage point rate hike in March and 7 hikes over the course of the next twelve months. Most now have a view - whether the Fed will hike slower than - or faster than the market expectation. As investors, Game Selection is a critical choice. What area can one spend their precious resource – time – and expect a differentiated insight from the rest of the market? For most, individual securities may be a good game. For others it may be macro forecasting. However, when it comes to the Fed, the base rate for successful prediction is abysmal for multiple reasons:
Source – Roberto Perli, Piper Sandler
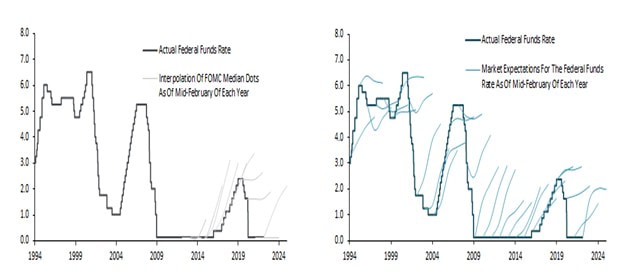
As correctly pointed by out by economist Roberto Perli in the chart on the right, most historical predictions on future Fed policy have been wildly incorrect. The lighter lines above represent market expectations for Fed Funds rates as of Mid-February of that year. As you can tell, the forecasts are spectacularly wrong. The lighter lines on the left chart are projections of the Fed itself about future rate hikes, and they are generally wrong also. Here is the punch line, select a game only when the odds of winning are high. When it comes to future rate increases, we are all speculating. So is the Fed. 2022 is likely to be a volatile period. The monetary help from the Fed over the past two years was unprecedented. The Federal authorities are now unwinding this help and unwinding it at a rapid pace. We are transition from a market assisted by a friendly Fed - to one - where the Fed is a headwind. They are draining the punch bowl. History suggests that these transitions are volatile and can take several months to play out. They also present fantastic opportunities in the right sectors and in individual stocks. Before we dive into the details, let’s examine the over arching factors that affect markets. What determines market direction?
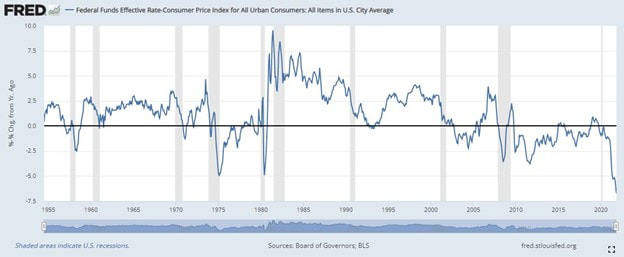
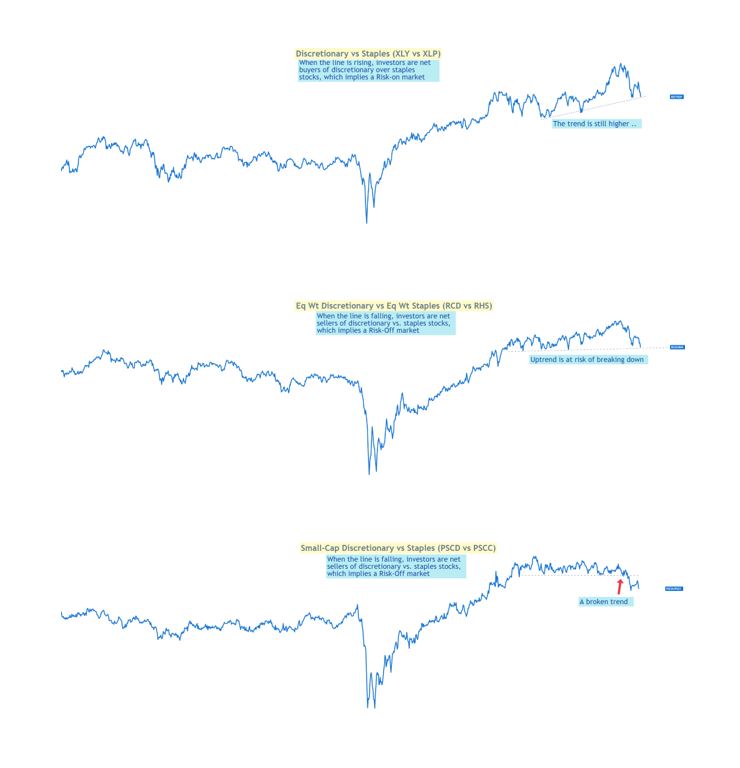
Earnings growth determines long term (multiple years) market direction. Change in liquidity (money supply) determines intermediate term (6-18 months) direction. Fed provides and takes away liquidity. At the outset of the pandemic, the Federal Reserve aggressively reduced rates and pumped record liquidity into the economy. This revived animal spirits, essential during a potential bust. Vaccines saved lives and the economy. However, as usual, the Fed kept the party going longer than they should have. A side effect of this monetary assistance (Fed + Govt) is inflation - which is the highest in decades – and has stayed high longer than the Fed expected. Fed Actions. Fed has a dual mandate; 1) get citizens back to work and 2) keep a lid on inflation. Unemployment rate is back to 3.9%. Mission 1 accomplished. Mission 2, not so much. The latest consumer price increase was 6.9%. Therefore, the real interest rate (nominal interest which is at zero minus consumer prices) is deeply negative at (6.9%). This rate is one for the history books (see above chart). Removing monetary accommodation is the only logical choice in this economic backdrop. In layman terms, the Fed will reduce the pace of bond purchases from $120 billion per month to $0 by March 2022. In addition, markets are also anticipating 3 -4 interest rate increases in 2022. Whether the Fed will follow through with these rate increases remains to be seen, but markets will have a difficult time digesting these expectations of changes in Fed policy. A ‘full punch bowl’, aka Fed assistance, along with earnings growth, has undeniably been an important factor helping the market’s ascent. Now, the punch bowl is at a risk of running dry. The canary in the coal mine, the weakest fall first. Markets are an iceberg, and what’s underneath the surface is most telling. While the surface is serene today, the depths have shown incredible churn and angst. The poor performance of ARK funds and frothy SPACs - is the first signal - markets are anticipating reduced liquidity. The weakest fall first. Small cap stocks have also struggled since March ‘21 (the point of maximum money growth), as they are more reliant on outside funding and tighter monetary conditions are looming. Both issues are well documented. So is market breadth. The relative weakness in discretionary stocks vs. staples stocks (as we move down market cap sizes) is also indicating a market advance that is defensive led. The strongest fall last.
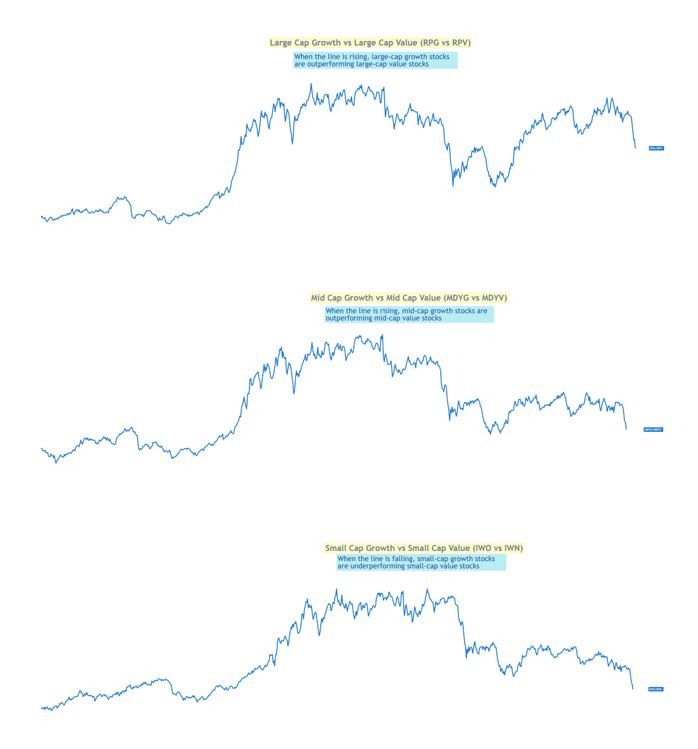
Over the years, the S&P has evolved into a more defensive and higher quality asset. Energy, industrials, material, and financials (value sectors) are a smaller representation. Growth and FANG dominate. Business valuations are determined by interest rates. Lower rates help, while higher rates hurt. Growth stock valuations are more sensitive to changes in rates. While inter-twined, falling interest rates were good for the market. Now, rates are rising, which will eventually pressure all growth assets, including the strongest. Take a look at the Growth vs. Value breakdown by market cap. The lines are increasingly sloping downwards as you move down market caps. Small cap growth stocks have underperformed their value counterparts since early 2021. As the Fed continues to raise rates, this weakness will spread to large cap stocks. It is possible that these negative conditions fix themselves. We must keep an open mind. It would require economic growth to remain strong and inflation to show consistent deceleration. This combination would allow the Fed to increase rates at a slower pace. However, yellow lights are flashing. This is also a strong sector and stock allocation signal. Value will do better than growth, and this relative strength should spread into more areas of the market. When the Fed is draining the punch bowl, it is a good time to be cautious and be ready for a deeper and prolonged correction in growth and low quality assets. The good news is that, cheaper prices and bargains are around the corner. -- This material does not constitute an offer or solicitation to purchase an interest in Latticework Partners, LP (the "Fund"). Such an offer will only be made by means of a confidential offering memorandum and only in those jurisdictions where permitted by law. An investment in the Fund is speculative and is subject to a risk of loss, including a risk of loss of principal. There is no secondary market for interests in the Fund and none is expected to develop. No assurance can be given that the Fund will achieve its objective or that an investor will receive a return of all or part of its investment. This material contains certain forward-looking statements and projections regarding the future performance and asset allocation of the Fund. These projections are included for illustrative purposes only, are inherently speculative as they relate to future events, and may not be realized as described. These forward-looking statements will not be updated in future. I tried to explain the concept of a brand to my seven-year-old. Twenty seconds into my explanation, I knew I was losing her. Soon thereafter, she found a reason to run away. My explanation was complicated. So, I looked up the definition of a brand on Investopedia.
The term brand refers to a business and marketing concept that helps people identify a particular company, product, or individual. Brands are intangible, which means you can't touch or see them. As such, they help shape people's perceptions of companies, their products, or individuals. Brands often use identifying markers to help create brand identities within the marketplace. They provide enormous value to the company or individual, giving them a competitive edge over others in the same industry. As such, many entities often seek legal protection for their brands by obtaining trademarks. The Investopedia description isn’t much better either. Ultimately, I challenged myself to describe a brand in one word. I came up with ‘trust’. Strong brands evoke strong emotions. Among all the emotions, trust is the most important one. Without trust, a brand cannot sustain itself over the long term. When I started to research what a brand stood for, I started my search on - of course - Google. I didn’t go to Yahoo, Bing, Ask.com, or any other place. I know that Google will bring me the most relevant results because the core mission of the Company is to index the world’s information. An entire SEO industry exists to make sure websites are optimized to be found on Google. Not for Excite.Com. So simply put, I trust that Google just isn’t another search engine, rather the best search engine. Trust elevates a business to brand status. Costco has the lowest prices. Costco’s gross margins are 15% - compared to 25% - for the rest of retail. Therefore, Costco marks up goods at half the rate that its competition does. This includes consumer goods, gas, or hot dogs. Most Costco customers know this by experience. Costco has built one of the greatest retail businesses in history by introducing price trust. Without trust, there cannot be a Brand. Families that are on the road, traveling with hungry kids, know that they can stop at the closest McDonalds, to make them Happy! That consistency of product and fast service - regardless of store or geography – is the key ingredient for hungry travelers. It's not any meal, it’s a Happy Meal. Fifteen years ago, buying a used car was a very different and unpleasant experience It meant going to many different mom and pop dealers, finding the car you wanted, haggling over the price, and then praying it wasn’t a lemon. Believe me, I’ve been on the wrong end of this transaction, more than once. Maybe you have also. There were a lot of things this market lacked, but the main one was trust. CarMax realized this and built a large business over several decades by eliminating lots of consumer pain points. They introduced no-haggle pricing, large inventory, easy trade-ins, easy returns, and many more features. This standardization tipped the market in its favor. Most importantly, CarMax introduced trust. Consumers at a grocery store can just pick up their favorite branded product just based on the logo of that product. We know it will taste the same, it will cost about the same, but picking up that particular branded product will cut down on ‘search costs’ for looking for the best alternative. Great consumer brands convey trust through product consistency and by eliminating search costs. Twenty years ago, Online businesses had to solve a critical problem of establishing buyer trust before they were willing to transact. The trust factor was solved by creating a customer review system. A significant number of great reviews by other customers meant the seller was trustworthy. Ebay built a great marketplace by introducing Paypal as a medium of trust between buyers and sellers who did not know each other. The seller was paid only after the buyer received and verified the purchase. Trust enables all marketplaces, especially Online marketplaces. Good businesses build customer trust through consistency. Without trust, it’s a transaction. That means a competitor can undercut you by lowering prices or take away business by introducing a product that is just slightly better. Trust elevates a business to brand status. Brands are the epitome of Trust. Armed with this information, I am hoping for better results in my next conversation with my daughter. -- This material does not constitute an offer or solicitation to purchase an interest in Latticework Partners, LP (the "Fund"). Such an offer will only be made by means of a confidential offering memorandum and only in those jurisdictions where permitted by law. An investment in the Fund is speculative and is subject to a risk of loss, including a risk of loss of principal. There is no secondary market for interests in the Fund and none is expected to develop. No assurance can be given that the Fund will achieve its objective or that an investor will receive a return of all or part of its investment. This material contains certain forward-looking statements and projections regarding the future performance and asset allocation of the Fund. These projections are included for illustrative purposes only, are inherently speculative as they relate to future events, and may not be realized as described. These forward-looking statements will not be updated in future. My daughter wanted a set of Russian dolls to play with. To watch her pack and unpack dolls these dolls made me think about how rare certain entrepreneurs are. Here is why: 90% of new businesses fail within a few years. Therefore, the entrepreneur that can grow and sustain a new business possesses a combination of resilience and critical thinking that is uncommon. To take it a step further, entrepreneurs that build second, and third unrelated business lines are rare breeds.
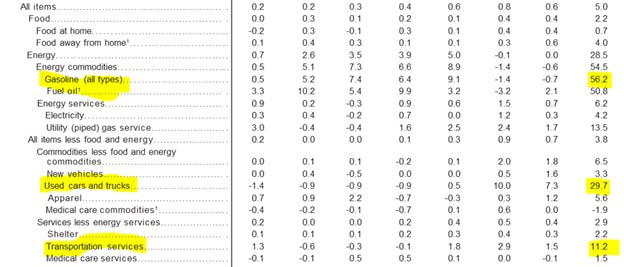
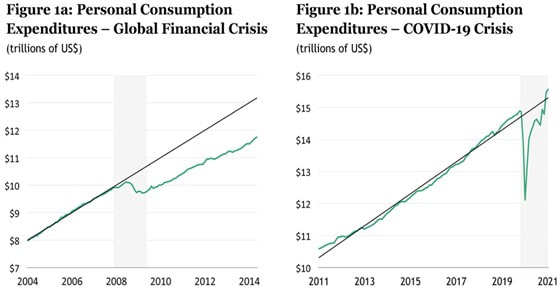
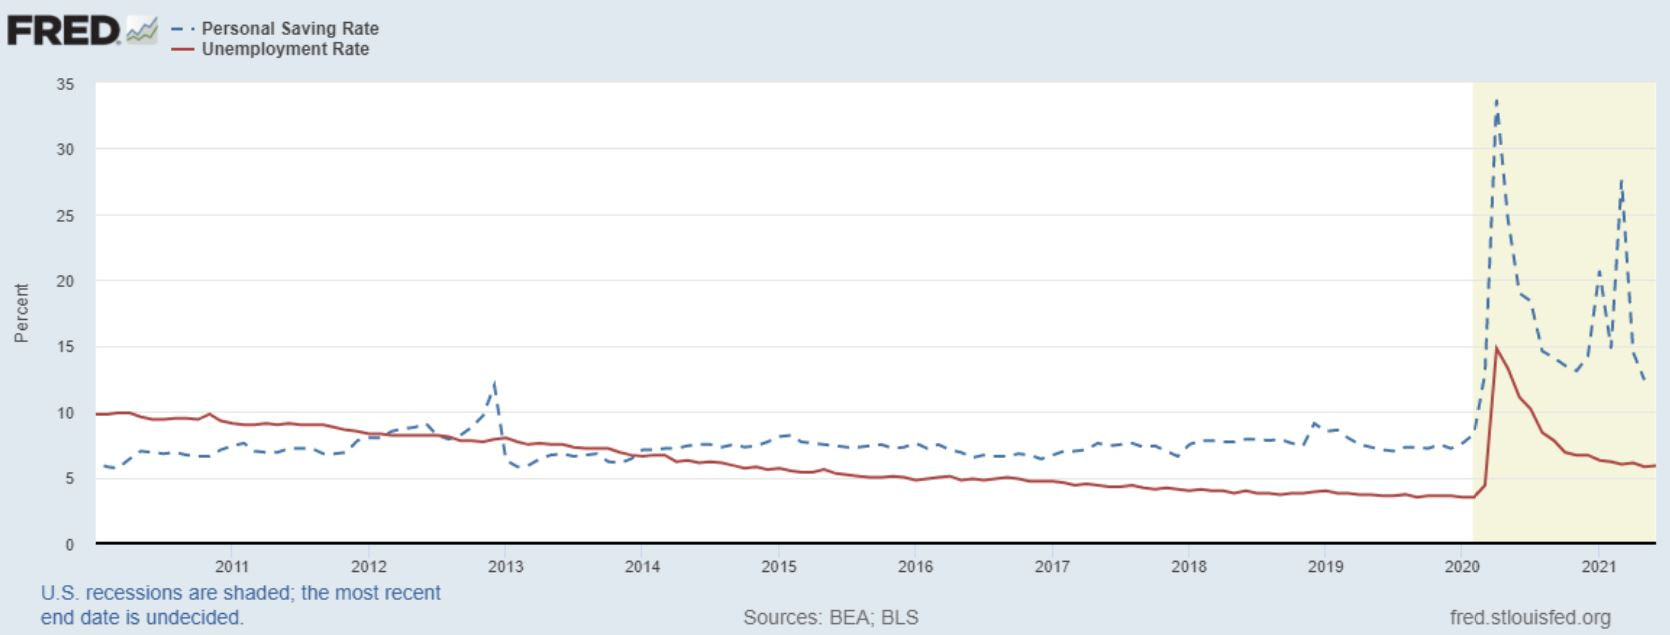
Then, there is Jeff Bezos. He sits on Mt. Rushmore for entrepreneurs. Not only he has built two of the biggest, yet unrelated businesses – but the sheer scale and leadership position that these businesses command are what makes these accomplishments absolutely jaw-dropping. The first one is the well know ‘everything retail store’. The second is one of the largest technology businesses in the world. Then there are advertising, logistics, hardware, and other future bets. No wonder Amazon is one of the highest valued businesses in the world. While ‘your margin is my opportunity’ is a well-known Bezos operating principle - others are less well known. (For a list of Bezos operating principles, here is a link to a blog post by Mr. Griffin (LINK) One of Amazon’s lesser-known core operating philosophy is to look at every major cost as an opportunity for a future source of revenue. And … have they done a miraculous job of executing on this initiative! The genesis of Amazon Web Services (AWS) - often referred to as the Cloud business - was one of necessity. Twenty years ago, Amazon - like the rest of retail - was a seasonal business. 50% of Amazon’s sales happened in the fourth quarter. The company needed massive excess server capacity to ensure customers could access their websites during the holiday season. However, most of this capacity was idle during the rest of the year. Jeff Bezos had an idea to rent out this excess capacity in the other three quarters to outside companies. Amazon Web Services was born. Here is a link to a great Twitter thread by an Amazon insider for background (LINK) In 2010, Amazon spent $1.7 billion on technology & content spending. In 2021, AWS is estimated to generate ~$60 billion in revenues with greater than 30% operating margins. This business is worth between $700 – 900 billion. Not only is AWS one of the most valuable technology businesses in the world – worth more than Adobe or Salesforce – but it is also the base layer or framework that other technology businesses are building on top of. Enabled by AWS, the cloud is eating software. Today, startups just get an account on AWS, instead of buying hardware. Entrepreneurs can focus on their core idea. AWS takes care of the rest. AWS has the distinction of single-handedly accelerating the pace of innovation and disruption for the world. Amazon Marketing services (AMS) is another example. Amazon has tremendous mindshare as close to 50% of American households today are Prime members. Therefore, Amazon is an obvious starting ‘search’ point for most consumer goods. It is much easier to show relevant Ads when consumers are telling you what they want. It is also easier to measure the efficacy of that advertising in a closed-loop system, such as the Amazon platform. On the other end, there are two million third-party sellers who need to showcase their products to high intent consumers. AMS is just leveraging this existing ecosystem, which makes its accomplishment less impressive, especially when compared to AWS. However, it is just as profitable. 2021 will be the first year when revenues from AMS will be greater than the total advertising expense of the entire Amazon business! Therefore, it is only a matter of time - that advertising - like AWS, will be a net income, rather than an expense. Global advertising is $650 billion dollars. Google and Facebook dominate online advertising. Today, AMS is small in the context of Amazon’s mindshare of consumers. However, as Apple introduces stricter rules around customer data tracking and Google eliminates the use of cookies, the data that Amazon has, becomes even more valuable for advertisers. It should not surprise anyone, if AMS, like AWS turns into an advertising juggernaut. The next, and currently, the most interesting one is Amazon Logistic services or AMZL. It is no secret that instant shipping is coming to most neighborhoods in America. To ensure a great order-to-delivery experience, Amazon is investing heavily in logistics, fulfillment centers, air capacity, and last-mile delivery. The sheer scale of Amazon’s current logistics investments is jaw-dropping. It far exceeds what Fedex, UPS, and DHL are incurring … cumulatively. It goes without question that Amazon wants to support the majority of its own business. However, some of these investments are also defensive in nature. Walmart and Target, through acquisitions, have figured out how to use their stores as shipping hubs. They have also grown their digital business faster than Amazon has, albeit from a much smaller base. The big question is will Amazon build a logistics network much greater than its own need and then rent out the excess capacity to other businesses? If the past is prologue, the answer is likely yes. Lastly, it is worth asking a few questions to directionally think about future businesses to emerge out of Amazon. Alexa! what are the largest costs for Amazon today? As we automate fulfillment centers, will robots replace the majority of human workers? If so, will Amazon build the best robots that can lead to full-scale picking and packing automation? Last-mile delivery is a significant cost item for Amazon. Will the Rivian acquisition provide the platform for autonomous delivery? Will Amazon build an automated fulfillment center floor for its own use and then produce that for competitors? What about Amazon Go and seamless checkout? Then there is healthcare. The list of potential Jeff’s dolls is long. In the year 2000, Amazon recorded sales of $2.7 billion. Last year, 2020, sales were $386 billion. That is an astounding revenue CAGR of 28%. Over the past three years, Amazon has averaged a 25% return on equity. The new businesses have a higher margin and require a lot less capital. Not only has Jeff produced dolls no one thought were possible, but the dolls are getting bigger and better. This month, Jeff Bezos stepped down as the CEO of Amazon, exactly 27 years after starting the company. He insists it's still Day 1 at Amazon. -- This material does not constitute an offer or solicitation to purchase an interest in Latticework Partners, LP (the "Fund"). Such an offer will only be made by means of a confidential offering memorandum and only in those jurisdictions where permitted by law. An investment in the Fund is speculative and is subject to a risk of loss, including a risk of loss of principal. There is no secondary market for interests in the Fund and none is expected to develop. No assurance can be given that the Fund will achieve its objective or that an investor will receive a return of all or part of its investment. This material contains certain forward-looking statements and projections regarding the future performance and asset allocation of the Fund. These projections are included for illustrative purposes only, are inherently speculative as they relate to future events, and may not be realized as described. These forward-looking statements will not be updated in future. This week, a Federal Anti-Trust judge dismissed the Federal Trade Commissions (FTC) case against Facebook. Let me start by saying that I am not a legal expert. However, we can always learn from the past. Historically, the successful anti-trust cases had one thing in common – they controlled supply. In an analog world, that mattered. Consumers had no other way of getting goods or services. However, Facebook, or other Tech giants for that matter, control demand. It is much harder to prove bad intentions when consumers keep coming back. This likely is just the beginning - not the end - of the FTCs pressure on tech giants. The outcome is …. complicated. Here is the link to the entire post from September 2019. [LINK] Is Inflation Here To Stay? For the past two decades, most companies have been rewarded for efficiency. Lean and mean was the way to operate. The global closing and reopening of businesses, government stimulus, and the lack of labor has exposed supply chains. Bottlenecks everywhere have exploded. The knock-on effects are also unpredictable. A chip shortage has affected new car production – exactly at a time - when consumers are moving to the suburbs in droves. In the absence of new cars, used cars are a hot commodity. As of May’s consumer price (CPI) report, used car and truck prices are 29% higher. Prices of oil were negative a year ago, and now they are in the 70’s. The business models of Uber and Lyft were predicated of rational economic principles. If demand rises, then raise prices. Higher prices (surge pricing) will incentivize drivers to offer their services, which will bring the market into equilibrium. The algorithm could not plan for Covid + unemployment benefit where drivers are incentivized to be a ‘couch potato’. In short, things are upside down. However, these disruptions are temporary. Over a year, most of these abnormalities will ‘normalize’. Does this mean we will revert to the old world of low growth and low inflation? Our economy is a complex machine. Post the global financial crisis, consumers had record low savings. The two major savings buckets: 1) home, and 2) 401k, were severely impaired. Therefore, consumer spending (green line) for several years post GFC was anemic and below trend (figure 1a from Blackstone). Post-Covid, we have an entirely new ball game. Consumption has raced above the trendline (figure 1b from Blackstone). Home prices and 401k’s are surging. It is logical to assume that spending will slow as stimulus runs out. However, as we exit 2021, the unemployment rate will be half of 2010’s level and savings rate will be more than double (see below). The simple conclusion here is that the pent-up demand to ‘live life’ after Covid is real and consumers have the resources to follow-thru. Roaring 20’s anyone? Is hyper-inflation in the forecast? The key condition for high inflation - is growth - that creates a sustained shortage of labor. While higher consumer spending is good for employment, there are lots of offsetting factors. Given the rate at which software and robotics are entering the adoption curve, any sustained tightness in labor is hard to envision. Investments in automation will accelerate and provide a key buffer. For once, the Federal Reserve may be correct to ignore the current high inflation readings, as temporary. I am hoping they get it right. As the great Yogi said, it’s tough to make predictions, especially about the future. -- This material does not constitute an offer or solicitation to purchase an interest in Latticework Partners, LP (the "Fund"). Such an offer will only be made by means of a confidential offering memorandum and only in those jurisdictions where permitted by law. An investment in the Fund is speculative and is subject to a risk of loss, including a risk of loss of principal. There is no secondary market for interests in the Fund and none is expected to develop. No assurance can be given that the Fund will achieve its objective or that an investor will receive a return of all or part of its investment. This material contains certain forward-looking statements and projections regarding the future performance and asset allocation of the Fund. These projections are included for illustrative purposes only, are inherently speculative as they relate to future events, and may not be realized as described. These forward-looking statements will not be updated in future. If you missed Picks and Shovels – Part I, read this first (LINK).
Tobacco stocks were the ‘Sin Sector’ of the past generation. These businesses were built to exploit human addiction to Nicotine. Despite rising prices of cigarettes and the ultimate risk - death – many consumers had to have their fix. Rising regulation could not stop Tobacco companies and they provided great returns to shareholders over several decades. Today, the dopamine hit has replaced the nicotine hit. While many aspire to quit checking their social updates, only a select few can claim victory. Technology companies have leveraged the building block of ‘dopamine’ to build great products that leverage the basic human need to be ‘liked’. Consumer engagement is strong. While smokers were a small subset of the population, social media consumers are virtually everyone with a mobile phone. The network benefits are strong. Social media is a two-sided network. Consumers on one end, advertisers on the other. As the total time spent by society on social media networks has grown, advertising spend has migrated over from traditional channels. Today, digital consumer engagement is a bare minimum for every business. Digital spending provides better attribution – easy to know what worked or what did not – and a much higher return on investment over alternatives. 30%-40% of venture capital raised is spent on advertising. Startups may not pay rent or taxes, but everyone pays the advertising tax to acquire new customers. If consumer acquisition cost (CAC) is the new rent (Link to an INC article) then social media properties are the new landlords. The distribution and scale moats are wide and deep. These companies make money by maximizing the amount of time spent on their platforms. To keep consumers interested, they innovate. Innovation has no limits. Video and original programming have been an easy way to increase the time spent. However, the progress in Augmented and Virtual Reality (AR/VR) has the potential to be the next platform of change. While we are already trying on clothes and interacting with brands using AR, the advancement and adoption of this technology has the potential to be truly revolutionary. The scale and range of applications would span multiple categories – from personal connection, education, science, entertainment, and work. “Imagine wearing a pair of glasses that lets you visit with your parents no matter where you are, tour the Louvre on your lunch break and walk and talk with a friend on the other side of the planet and truly feel that they are at your side” – Social Media Company It took two decades to go from a clunky, mobile box phone, to a supercomputer in our pockets. With the dizzying rate of improvement in chip design, gaming, 5G, and cloud computing, new platforms are evolving fast. Therefore, we are likely to go from a bulky headset or glasses to something elegant and consumer-centric much faster than we believe. The day that I can box with Mike Tyson, play one-on-one basketball with Michael Jordan is not that far off. Imagine this new “new world” collide with advancements in data science where advertisements are the ones we want to see. A complex auction process that quietly runs in the back connects advertisers with consumers who are most likely to enjoy that piece of content. While this might be hard to envision today, this is the goal. On the flip side, AR/VR might not evolve to engage consumers. Advertising is inherently a cyclical business. The tide is venture capital spending could recede in a recession. The regulatory drumbeat could get louder and act against big Technology. The investing business is full of risks, and unless one has a way of handicapping and underwriting the risks and the rewards, it is better to stay on the sidelines. The best investments are the ones where consensus opinion on a business is the glass half empty, but we see enormous future opportunities. This opportunity also needs a leader who is a proven visionary, a valuation that is mouth-watering, with a strong core that can handle external setbacks. Then we sit and wait…. --- This material does not constitute an offer or solicitation to purchase an interest in Latticework Partners, LP (the "Fund"). Such an offer will only be made by means of a confidential offering memorandum and only in those jurisdictions where permitted by law. An investment in the Fund is speculative and is subject to a risk of loss, including a risk of loss of principal. There is no secondary market for interests in the Fund and none is expected to develop. No assurance can be given that the Fund will achieve its objective or that an investor will receive a return of all or part of its investment. This material contains certain forward-looking statements and projections regarding the future performance and asset allocation of the Fund. These projections are included for illustrative purposes only, are inherently speculative as they relate to future events, and may not be realized as described. These forward-looking statements will not be updated in future. |
Amol DesaiI am an investor and these are my personal thoughts on investing, behavioral finance, markets, and sports viewed through the prism of a Latticework |
Proudly powered by Weebly
